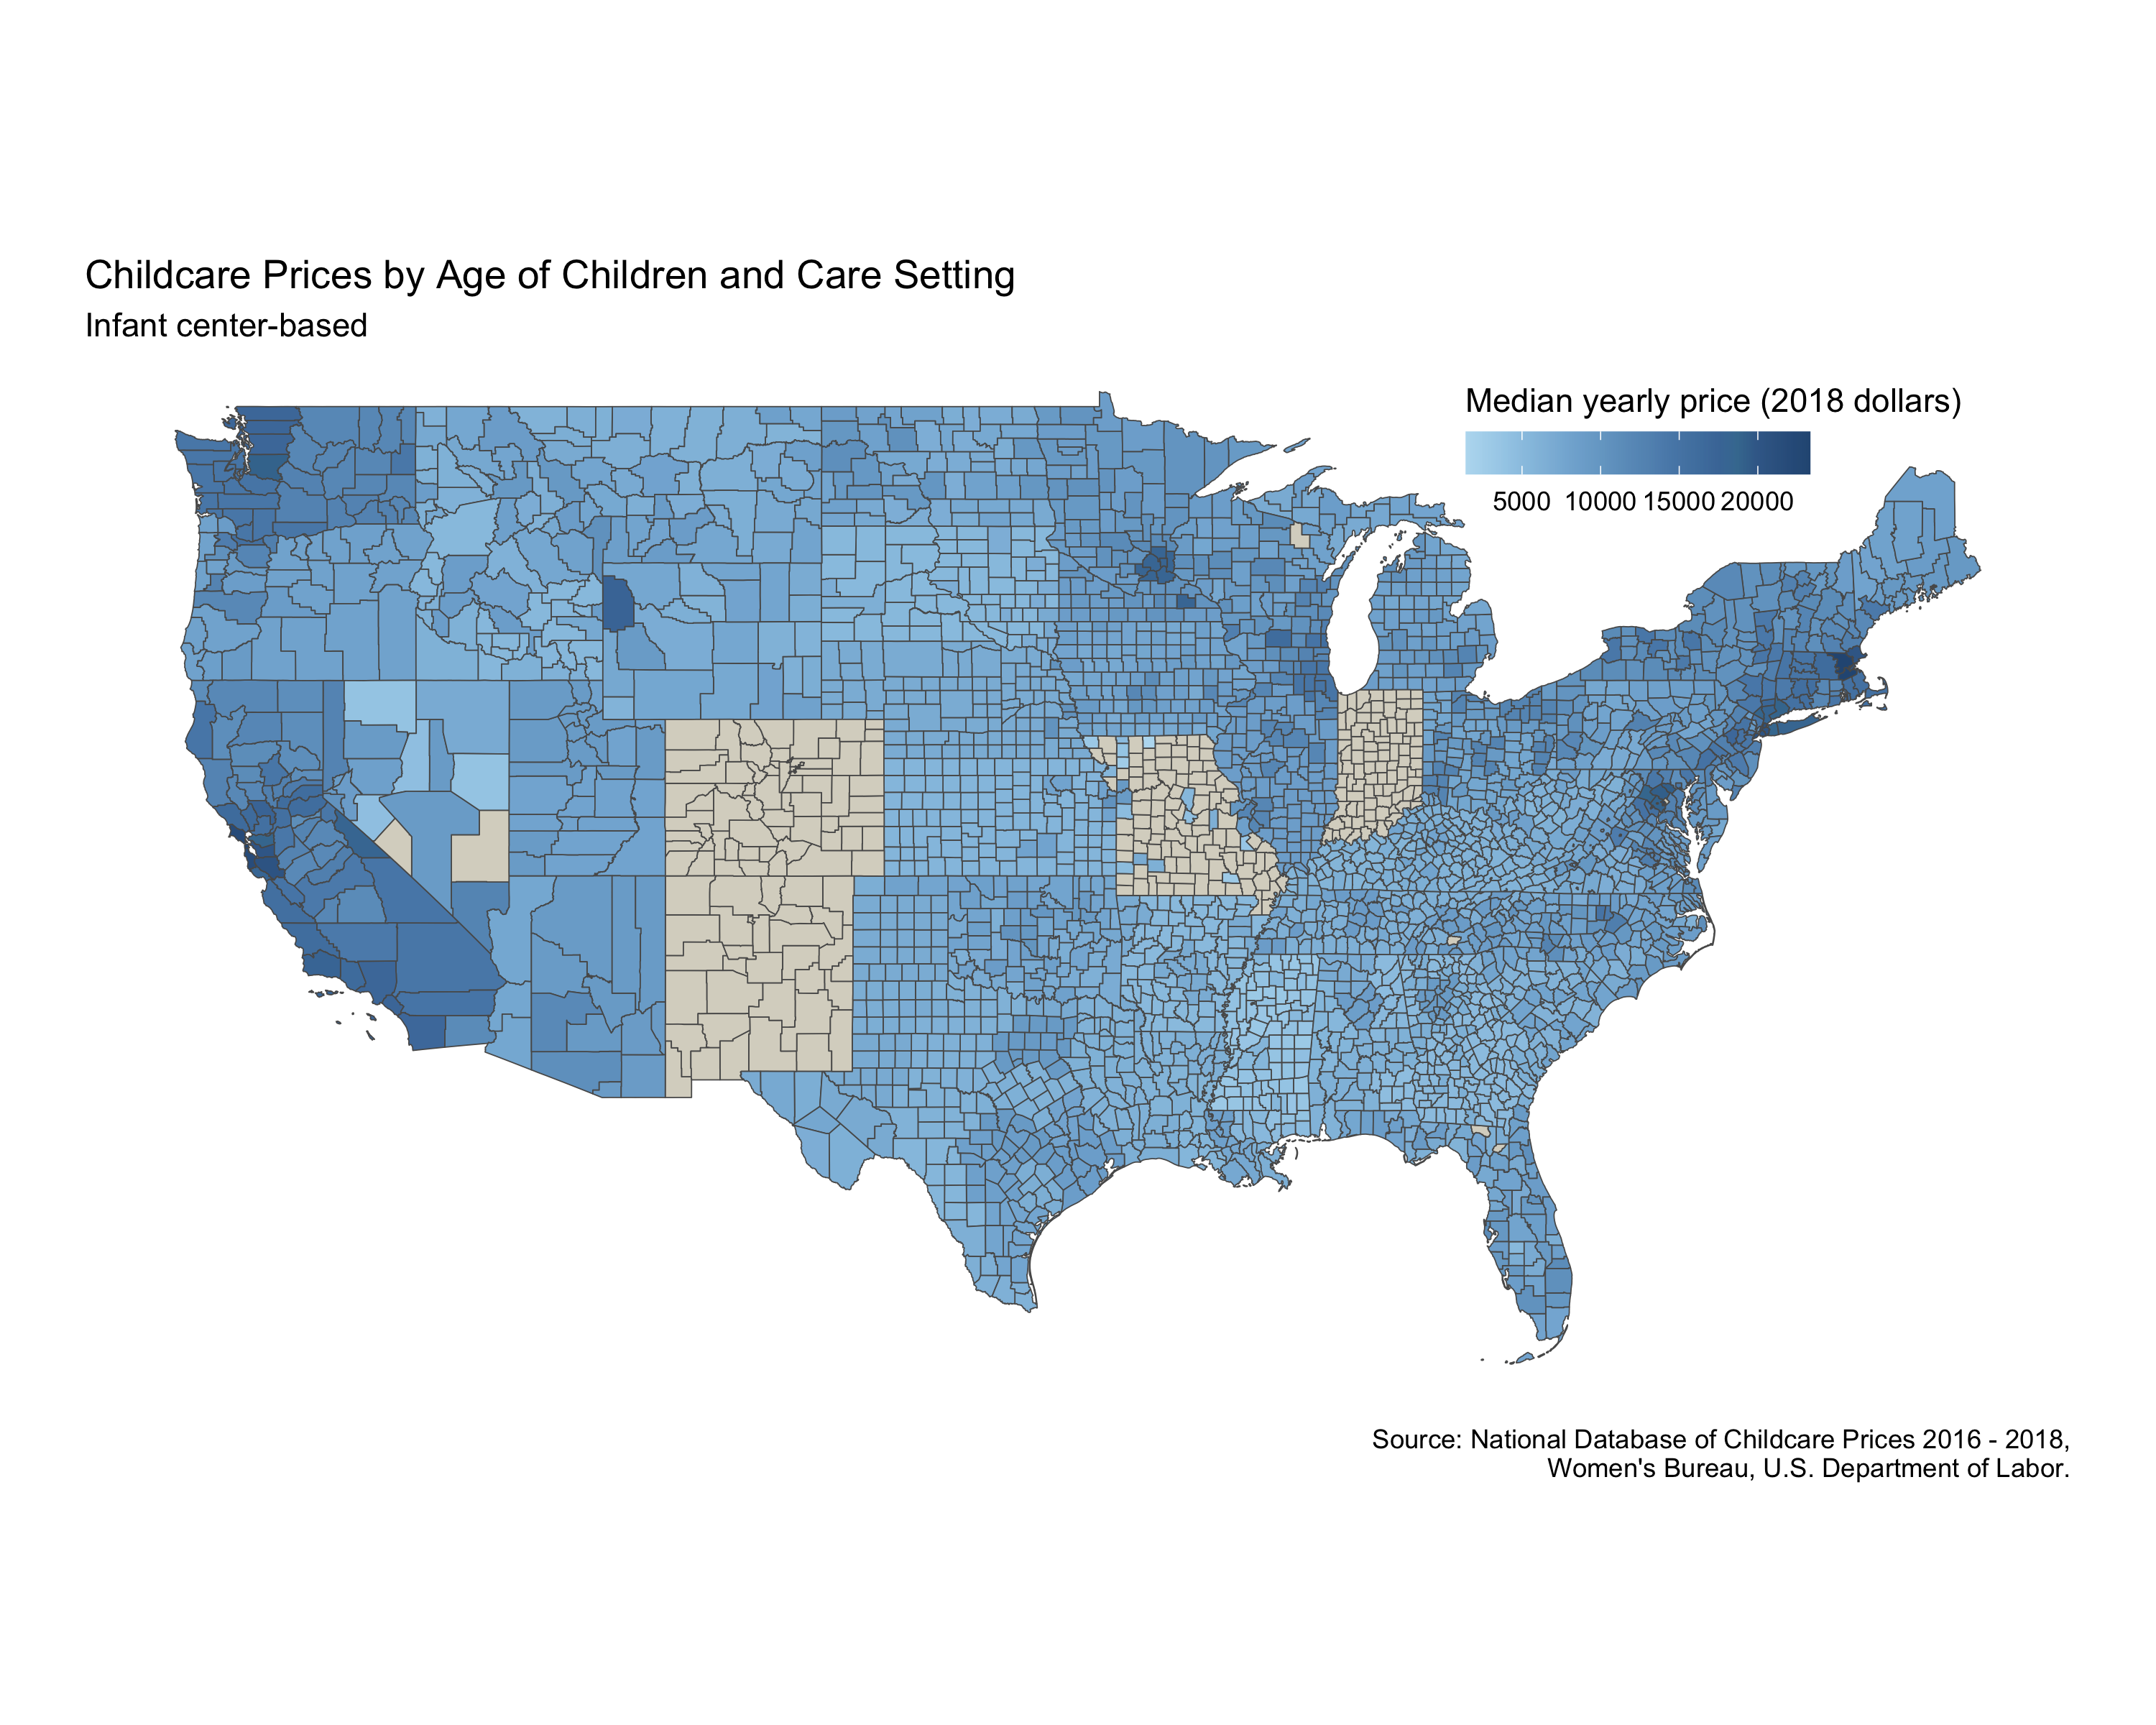
The plot below is my attempt to recreate in {{ggplot2}} one of the plots at https://www.dol.gov/agencies/wb/topics/childcare/price-by-age-care-setting. Namely the plot that greets you when you follow the above link, with the price selector dropdown at the default value of “Infant center-based”.
I faced one or two difficulties in trying to recreate the original plot. One issue I didn’t resolve was how to adjust the prices for CPI-U (the Consumer Price Index for All Urban Consumers). It was easy enough to figure out what calculation needed to be done but I couldn’t find a source of CPI-U for childcare costs in the USA between 2016 and 2018.
Another issue I failed to resolve was how to add maps of Alaska and Hawaii to the plot of the rest of the USA.
The code behind my plot is here: https://github.com/MHenderson/childcare-costs